Charting new territories in hematology: the impact of spatial proteomics on cancer research
Posted on:
With their diverse phenotypes and origins, hematological malignancies present a significant challenge in pathology. Originating from a wide range of immune cells, these cancers require a specialized approach to diagnosis and treatment. Traditional methods, primarily morphological evaluations, and single-plex immunohistochemistry, are now being surpassed by advanced techniques in spatial proteomics on Formalin-Fixed Paraffin-Embedded(FFPE)sections.
Current limitations
The gold standard in most clinical pathology laboratories is single-plex, chromogenic immunohistochemistry. This technique necessitates separate FFPE tissue sections for each antibody, hindering the ability to evaluate all markers on the same section. This approach raises concerns about potential misdiagnosis due to biological variances between sequential sections, depleting tissue samples rapidlywhiledelaying diagnosis and treatment1,2. Additionally, even thoughflow cytometry-based immunophenotyping evaluates multiple biomarkers, it lacks crucial spatial context.
The breakthrough with COMET™
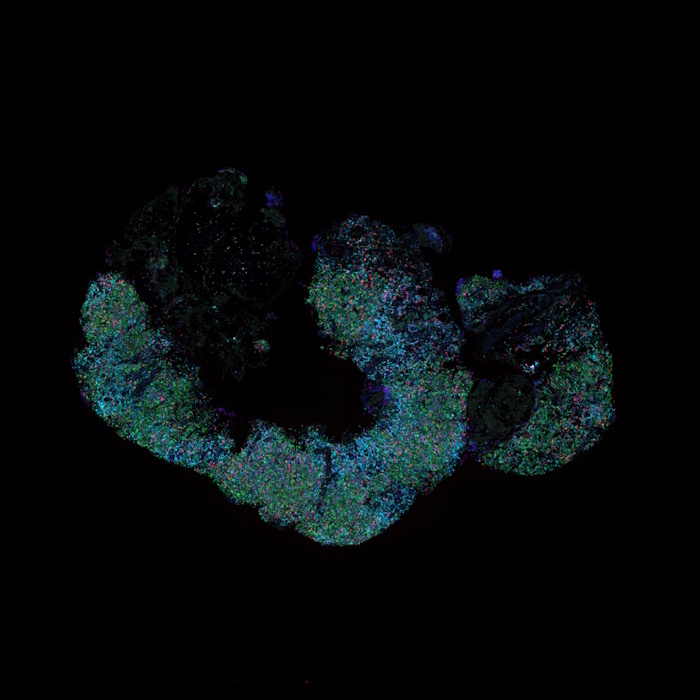
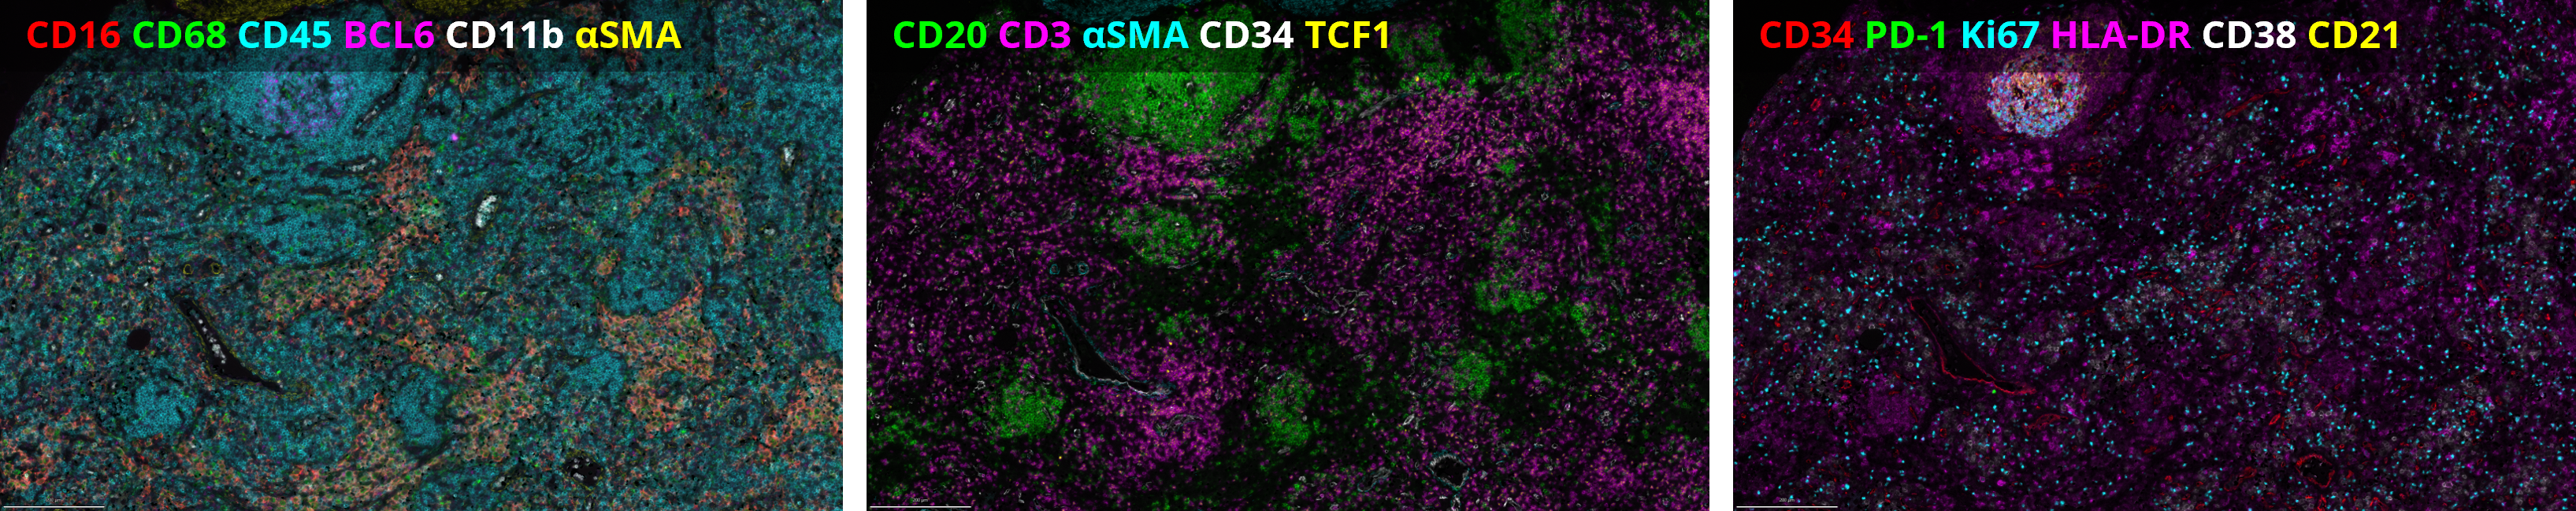
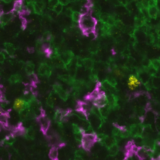
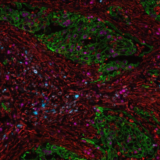
With the emergence of spatial proteomics, like Lunaphore’sCOMET™ platform, researchers now have the unprecedented capability to visualize and quantify multiple biomarkers within the spatial context of the tumor microenvironment.A recent collaborative study by Lunaphore and internationally renowned EPFL presented at the Society for Immunotherapy of Cancer’s (SITC) 38th Annual Meeting,made significant strides in lymphoma research using sequential immunofluorescence (seqIF™) with a hyperplex immuno-oncology panel containing 34 markers(Figure 1). The analysis was performed on reactive lymphadenopathy and Non-Hodgkin Lymphoma (NHL) FFPE samples and produced OME-TIFF images with reproducible spatial single-cell data for downstream analysis.
Figure 1. Example of composite images generated from the 34-plex seqIF™ panel. Scale bar: 200 μm.
Theinitial optimization and verification using a single reactive lymphoid hyperplasia case demonstrated the feasibility of this approach. Subsequently, the panel was successfully transferred to the rest of the patient cohort(N=8).
Advantages of automation in spatial biology
Exclusive content
Please tell us a bit about yourself to unlock this content.
With their diverse phenotypes and origins, hematological malignancies present a significant challenge in pathology. Originating from a wide range of immune cells, these cancers require a specialized approach to diagnosis and treatment. Traditional methods, primarily morphological evaluations, and single-plex immunohistochemistry, are now being surpassed by advanced techniques in spatial proteomics on Formalin-Fixed Paraffin-Embedded(FFPE)sections.
Current limitations
The gold standard in most clinical pathology laboratories is single-plex, chromogenic immunohistochemistry. This technique necessitates separate FFPE tissue sections for each antibody, hindering the ability to evaluate all markers on the same section. This approach raises concerns about potential misdiagnosis due to biological variances between sequential sections, depleting tissue samples rapidlywhiledelaying diagnosis and treatment1,2. Additionally, even thoughflow cytometry-based immunophenotyping evaluates multiple biomarkers, it lacks crucial spatial context.
The breakthrough with COMET™
With the emergence of spatial proteomics, like Lunaphore’sCOMET™ platform, researchers now have the unprecedented capability to visualize and quantify multiple biomarkers within the spatial context of the tumor microenvironment.A recent collaborative study by Lunaphore and internationally renowned EPFL presented at the Society for Immunotherapy of Cancer’s (SITC) 38th Annual Meeting,made significant strides in lymphoma research using sequential immunofluorescence (seqIF™) with a hyperplex immuno-oncology panel containing 34 markers(Figure 1). The analysis was performed on reactive lymphadenopathy and Non-Hodgkin Lymphoma (NHL) FFPE samples and produced OME-TIFF images with reproducible spatial single-cell data for downstream analysis.
Figure 1. Example of composite images generated from the 34-plex seqIF™ panel. Scale bar: 200 μm.
Theinitial optimization and verification using a single reactive lymphoid hyperplasia case demonstrated the feasibility of this approach. Subsequently, the panel was successfully transferred to the rest of the patient cohort(N=8).
Advantages of automation in spatial biology
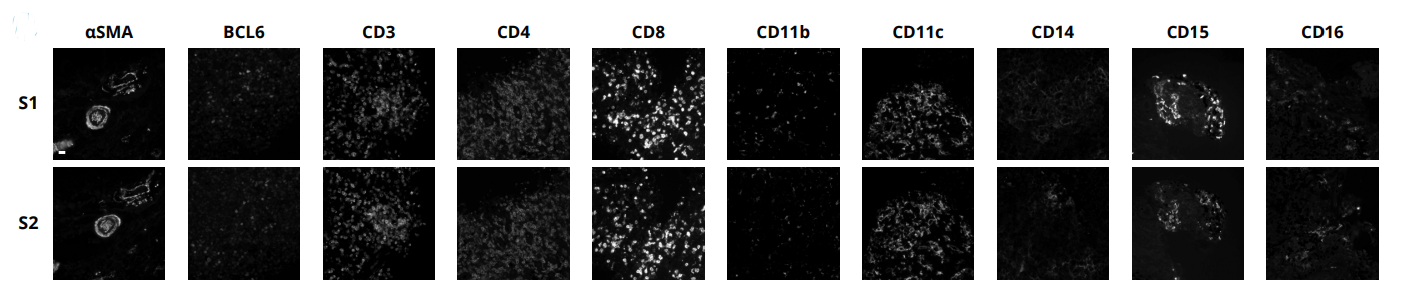
The integration of automation in spatial proteomics is game-changing. It provides reproducibility (Figure 2), reduces human error, and significantly accelerates the throughput of experiments. In the context of hematological malignancies, large cohorts of samples can be analyzed consistently and efficiently, providing robust data that can drive forward our understanding of these diseases. In addition, automated spatial proteomics enables precise and accurate co-localization of multiple biomarkers within a single FFPE section. These advantages reinforce the tremendous potential of thishyperplex approach in better characterizing the heterogeneity within hematological malignancies as well as in identifying novel therapeutic targets and biomarkers for patient stratification.
Figure 2. Demonstration of the seqIF™ staining reproducibility for selected markers on two consecutive tissue sections (S1 and S2) from a Marginal Zone Lymphoma (MZL) FFPE sample. Brightness increased 40% uniformly across all images for visualization, no contrast adjustment. Scale bar: 20 μm.
From images to data analysis
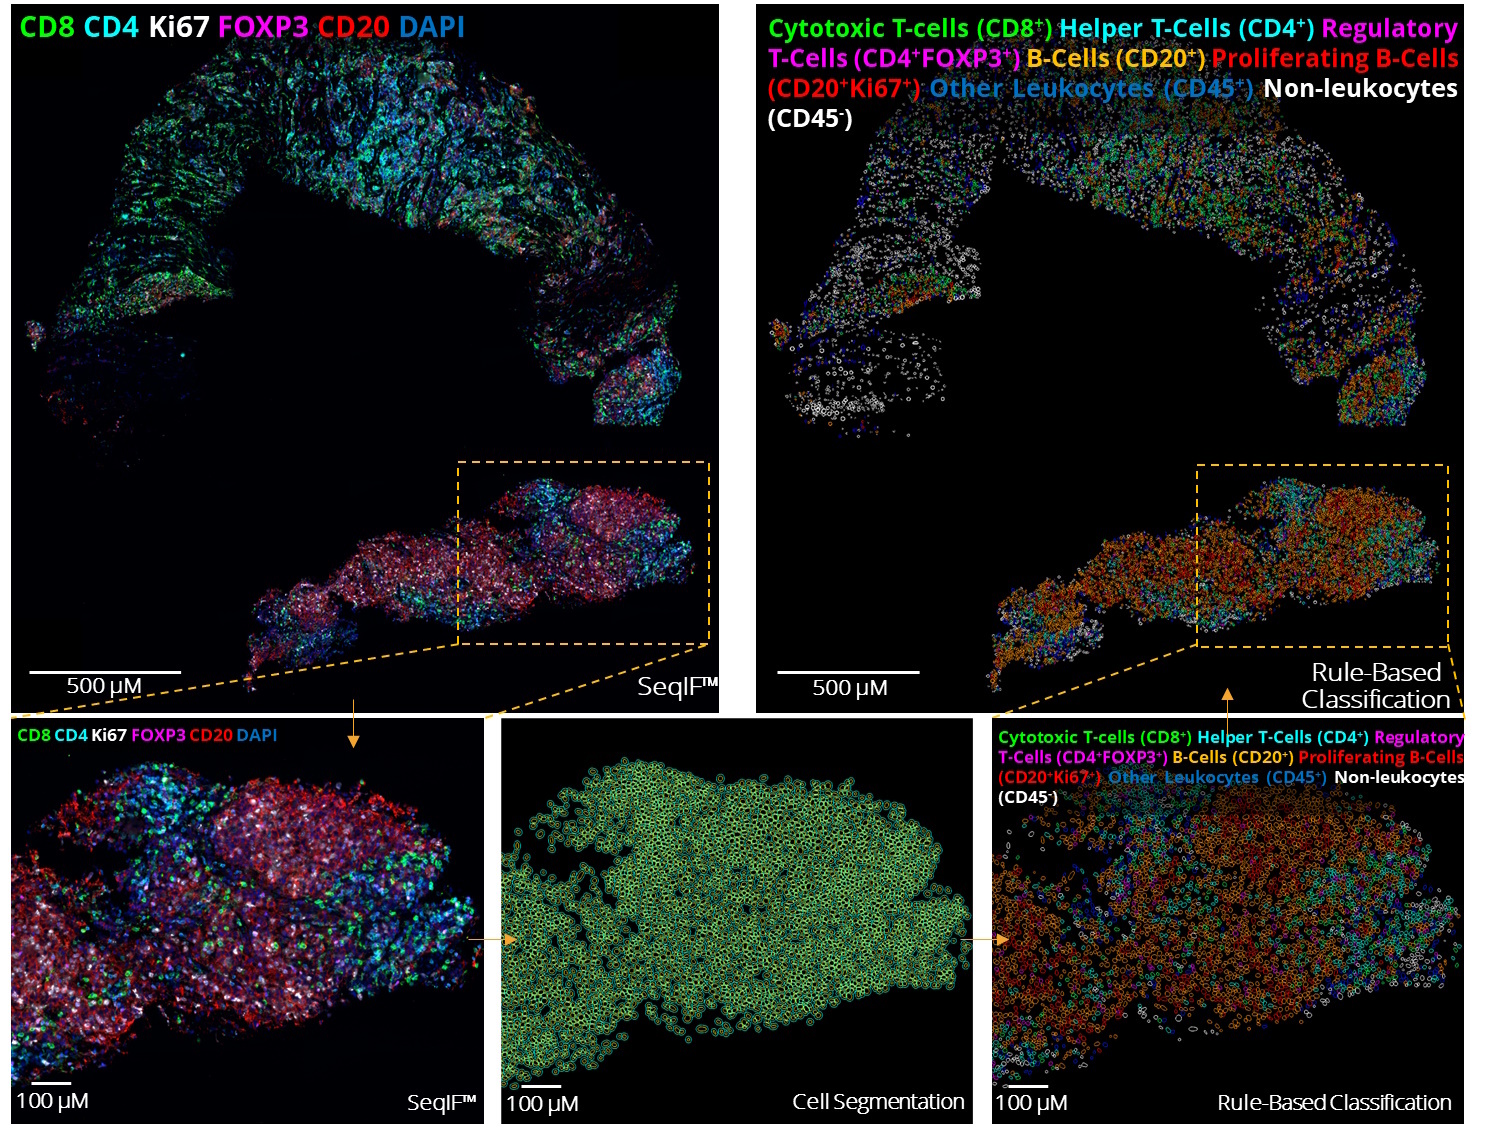
Background subtraction, cell segmentation, and cell phenotyping were performed by HORIZON™, an image analysis software tailored to COMET™ hyperpleximmuofluorescence images (Figure 3). HORIZON™ provides automated and ready-to-use nuclei segmentation and cell border approximation. This user-friendly approach leverages the StarDist algorithm, which is pre-trained on COMET™ images. Rule-based classification allows to pinpoint marker expression in cells with the highly reactive thresholding function and create cell classification rulesets via an intuitive graphical interface to identify cells with a known phenotype.
Figure 3. Top left panel: seqIF™ composite image of a Germinal Center-like Diffuse Large B-cell Lymphoma acquired with COMET™ (autofluorescence subtracted). Top Right panel: Nuclei segmentation masks colored according to their cell phenotype obtained from the rule-based classifier. Bottom left: zoomed-in region of interest of the top left panel. Bottom center image: cell segmentation performed with HORIZON™ software (nuclei and cell outlines masks) on zoomed-in region of interest of the right panel. Bottom right panel: zoomed-in region of interest of the top right panel with rule-based classification, showing each nuclei mask with their assigned phenotype color.
The proof-of-concept work with COMET™ and seqIF™ in hematological malignancy research marks a significant milestone. This method reduces experimental turnover and sample consumption while providing a detailed analysis of the tumor-stroma interactions.
discover the full hyperplex immuno-oncology panel containing 34 markers on reactive lymphadenopathy and NHL FFPE samples;
learn about the cellular detection and phenotyping analysis pipeline performed with HORIZON™;
evaluate seqIF™ staining reproducibility for all 34 markers on two consecutive tissue sections.
References:
Chen L. et al. Changing causes of death in persons with haematological cancers 1975-2016. Leukemia. 2022. 36(7):1850-1860. doi: 10.1038/s41375-022-01596-z.
Syrykh C. et al. Lymph node excisions provide more precise lymphoma diagnoses than core biopsies: a French Lymphopath network survey. Blood. 2022. 140(24):2573-2583. doi: 10.1182/blood.2022015520.