Webinar
HORIZON™ drives insights into the glioblastoma tumor microenvironment
Posted on:
Spatial biology is redefining how researchers study the tumor microenvironment (TME) by combining cellular detail with spatial context. A crucial part of this process is image analysis, where images captured from spatial biology platforms are investigated in detail to determine what cell types are present in the TME, which molecules they express, and how they interact with each other.
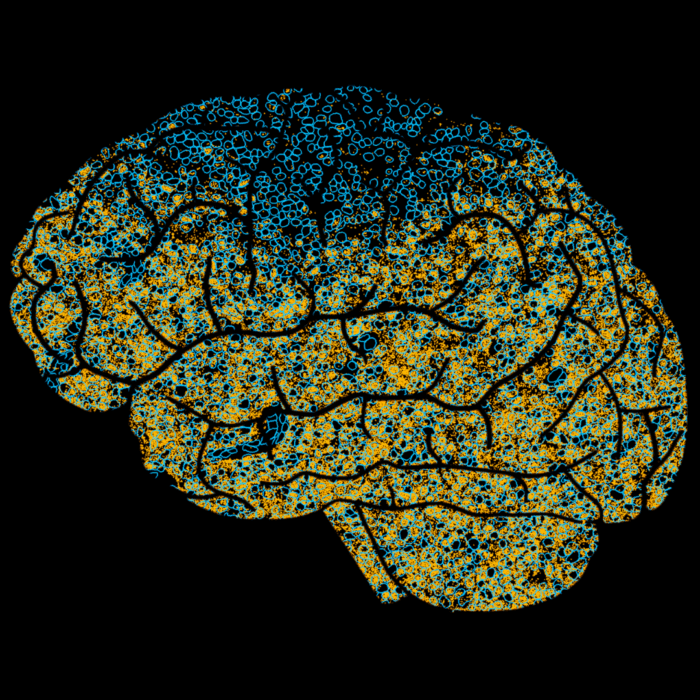
In a recent European Association for Cancer Research (EACR) webinar, we showcased how Lunaphore’s HORIZON™ image analysis software – designed for COMET™ images – enables intuitive, AI-powered, and scalable single-cell analysis across complex multiomics datasets (Fig.1). The software helps researchers uncover novel insights by streamlining data interpretation and enabling confident, spatially resolved phenotyping.

The challenge: deriving actionable glioblastoma insights from spatial biology data
With hyperplex technologies generating increasingly rich spatial datasets, researchers need powerful image analysis tools to keep pace. These tools must be not only robust, but also intuitive and adaptable to diverse experimental needs.
A full image analysis workflow with HORIZON™ was showcased during the webinar, using a real-world dataset of 16 glioblastoma tissue samples treated with two different therapies. The dataset, provided by KU Leuven’s Department of Imaging and Pathology, enabled direct comparison of treatment responses at the cellular level.
Glioblastoma is one of the most aggressive primary brain tumors. It presents significant challenges in diagnosis and treatment, partly because its TME is notably heterogenous, comprised of a wide variety of cell types. Deeper insights into exactly how the glioblastoma TME responds to different treatments can therefore be game-changing.
Hyperplex image analysis: step by step
A multiomics protocol was performed on COMET™, a high-throughput spatial biology platform, to stain tissue samples and capture hyperplex images.
The following steps were then performed using HORIZON™:
- Enhacing the image: background subtraction
HORIZON™’s built-in background subtraction tool was used to remove naturally-occurring autofluorescence – a common challenge in fluorescence-based tissue imaging. This improves the signal-to-noise ratio for accurate detection of true signals and quantification of the markers of interest.
- Mapping the TME: dot detection & cell segmentation
Accurately measuring RNA expression in the glioblastoma TME relied on HORIZON™’s ability to detect fluorescent “dots” of varying brightness, which represent individual RNA molecules within the tissue. HORIZON™’s deep learning model, trained on COMET data, can identify RNA transcripts with high precision, while an intensity filter helps researchers exclude false positives.
To accurately quantify protein and RNA signal, segmentation of individual cells is essential. But this can often be difficult in glioblastoma due to the high heterogeneity of the tissue, with cells exhibiting a wide variety of shapes and sizes.
To improve detection, the researchers used cell segmentation algorithm on HORIZON™. The algorithm leverages a deep learning model trained on COMET™ data and can leverage nuclear, cytoplasmatic and membrane markers to precisely identify cell boundaries. This worked even on cells positive for CD68 or CD34, difficult to segment due to their irregular shapes.
- Quantitative profiling: cell feature extraction
Related Articles
The Spatial Biology Week™ 2022: accelerating discoveries through a spatial lens
Posted on 22 Nov 2022
Read Post