Poster
Charting new territories in hematology: the impact of spatial proteomics on cancer research
Posted on:
With their diverse phenotypes and origins, hematological malignancies present a significant challenge in pathology. Originating from a wide range of immune cells, these cancers require a specialized approach to diagnosis and treatment. Traditional methods, primarily morphological evaluations, and single-plex immunohistochemistry, are now being surpassed by advanced techniques in spatial proteomics on Formalin-Fixed Paraffin-Embedded (FFPE) sections.
Current limitations
The gold standard in most clinical pathology laboratories is single-plex, chromogenic immunohistochemistry. This technique necessitates separate FFPE tissue sections for each antibody, hindering the ability to evaluate all markers on the same section. This approach raises concerns about potential misdiagnosis due to biological variances between sequential sections, depleting tissue samples rapidly while delaying diagnosis and treatment1,2. Additionally, even though flow cytometry-based immunophenotyping evaluates multiple biomarkers, it lacks crucial spatial context.
The breakthrough with COMET™
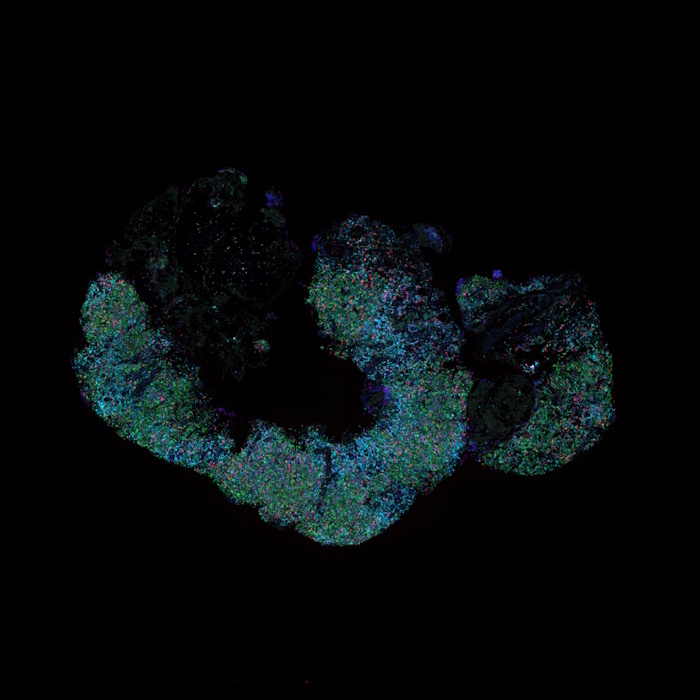
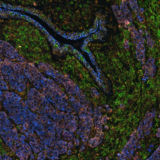
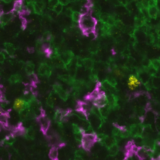
With the emergence of spatial proteomics, like Lunaphore’s COMET™ platform, researchers now have the unprecedented capability to visualize and quantify multiple biomarkers within the spatial context of the tumor microenvironment. A recent collaborative study by Lunaphore and internationally renowned EPFL presented at the Society for Immunotherapy of Cancer’s (SITC) 38th Annual Meeting, made significant strides in lymphoma research using sequential immunofluorescence (seqIF™) with a hyperplex immuno-oncology panel containing 34 markers (Figure 1). The analysis was performed on reactive lymphadenopathy and Non-Hodgkin Lymphoma (NHL) FFPE samples and produced OME-TIFF images with reproducible spatial single-cell data for downstream analysis.
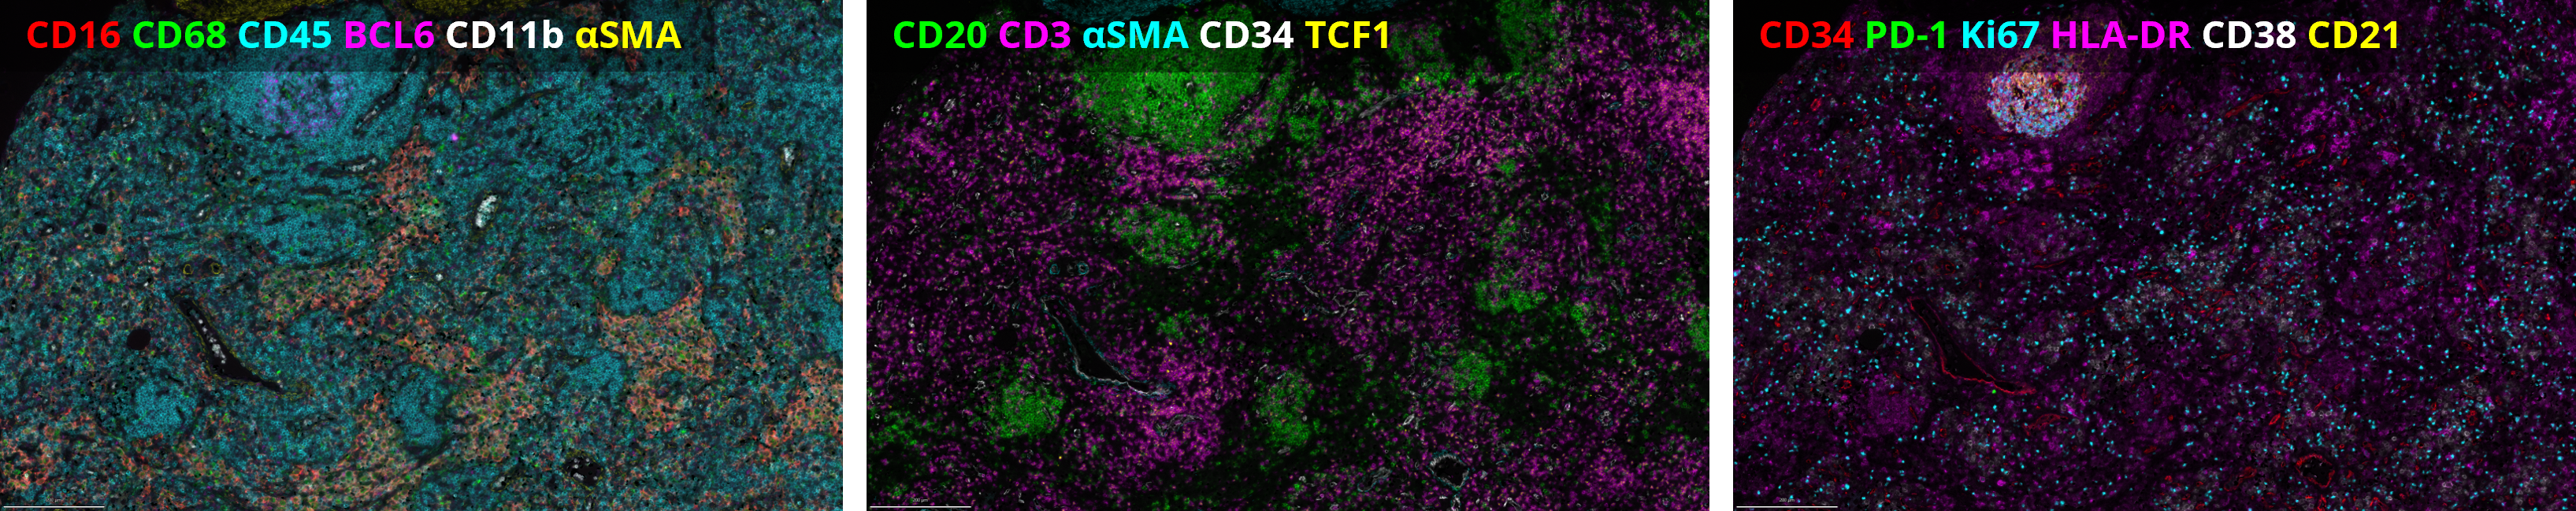
The initial optimization and verification using a single reactive lymphoid hyperplasia case demonstrated the feasibility of this approach. Subsequently, the panel was successfully transferred to the rest of the patient cohort (N=8).
Advantages of automation in spatial biology
Related Articles
Cytokines, spatial activation and tumor infiltration: the future of immunotherapy
Posted on 13 Dec 2023
Read Post